

Welcome to the world of Linked Data Types—one of Excel 365’s most quietly powerful features. While formulas like VLOOKUP, XLOOKUP, and SUMIFS often steal the spotlight, Linked Data Types work like mini databases inside your cells. And yes, they’re smarter, faster, and more intuitive than ever in Excel 365.
Whether you’re managing stock portfolios, tracking company metrics, planning trips, or organizing class schedules, linked data types can turn boring lists into interactive dashboards. And the best part? You don’t have to be a power user to make the most of them.
Let’s dive into how Linked Data Types in Excel 365 can help you work smarter, not harder.
🧠 What Are Linked Data Types?
In simple terms, Linked Data Types are cells that contain not just text or numbers—but structured data connected to a rich online source (usually Microsoft’s trusted partners like Wolfram Alpha, Bing, and others).
For example:
- Turn “France” into a country data type, and get instant access to population, currency, GDP, etc.
- Turn “Tesla” into a stock data type and view real-time ticker data, market cap, and performance.
- Use custom Power BI data types to pull organization-specific metrics straight into Excel.
🔍 Why They’re Revolutionary:
- Each linked data type is like a living, breathing database.
- You can extract specific fields using dot notation or Excel’s built-in field card.
- Data refreshes automatically—no scraping or re-downloading required.
- It works across your Excel workbook and integrates with other Office tools.
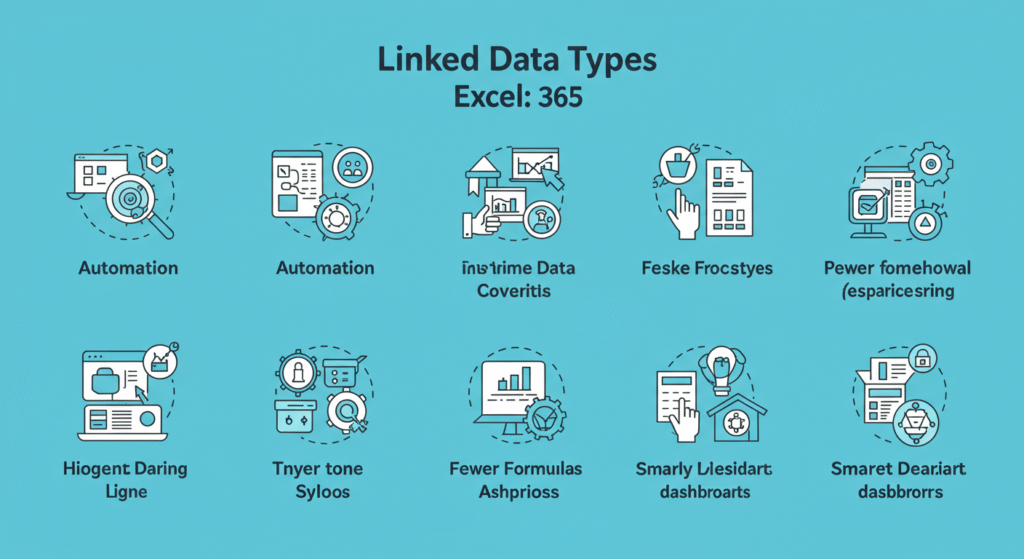
💡 Types of Linked Data You Can Use Today
Excel 365 includes several ready-to-use linked data categories:
✅ Geography
- Countries, cities, regions
- Fields: population, area, timezone, leaders, flag image
✅ Stocks & Financials
- Publicly traded companies, mutual funds, ETFs
- Fields: price, high/low, dividend yield, PE ratio
✅ Academic & Science (via Wolfram)
- Elements, planets, chemistry data, nutrition, weather, etc.
- Great for educators, researchers, and students
✅ Organizational (Power BI)
- Custom enterprise data from Power BI dataflows
- For internal metrics like sales regions, KPIs, employee data
✅ Custom Tables from Power Query or Power BI
- Your own tables, converted into linked records
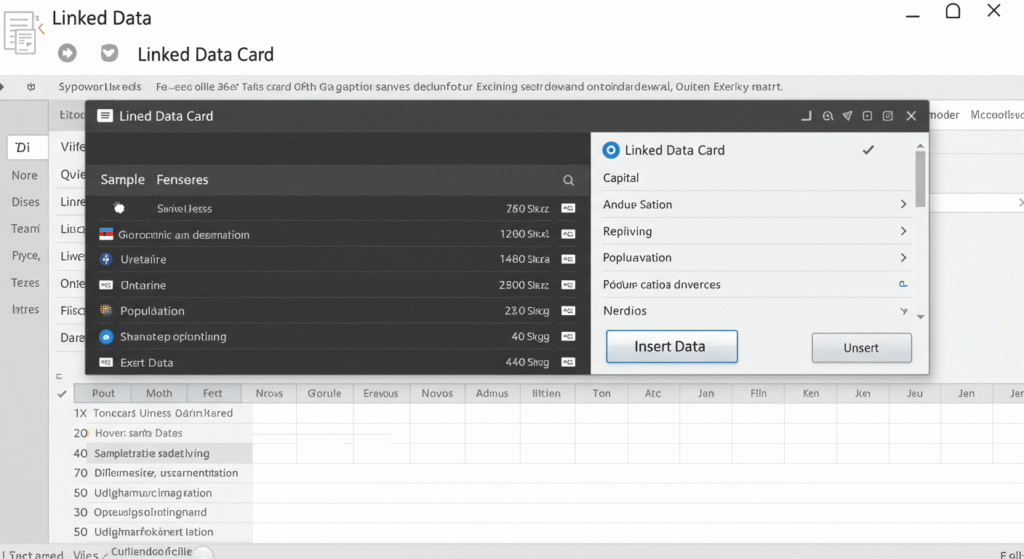
🛠️ How to Use Linked Data Types in Excel 365
Here’s how to go from plain text to smart, linked data in seconds:
Step-by-Step:
- Type a recognizable entity into a cell (e.g., “Microsoft”, “Brazil”).
- Select the cell, then go to the Data tab.
- Choose the appropriate data type (e.g., Stocks or Geography).
- Excel connects to its data provider and transforms the cell.
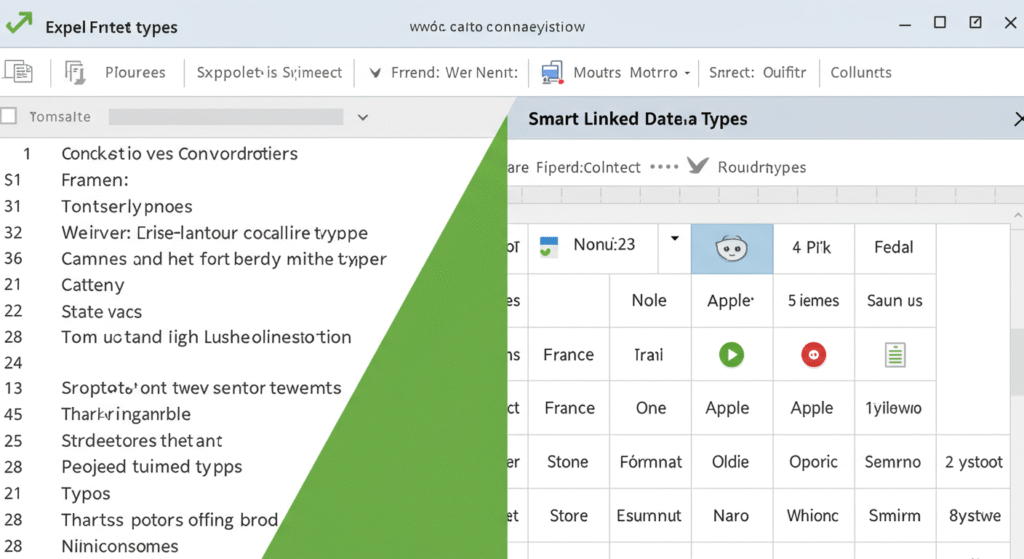
- Click the small icon in the cell to open a data card.
- Use the Insert Data button to extract fields into nearby columns.
Voila! You’ve just built a smart, dynamic mini-database.
🎯 Real-World Use Cases (and Smart Ways to Use Them)
📈 1. Financial Dashboards with Real-Time Data
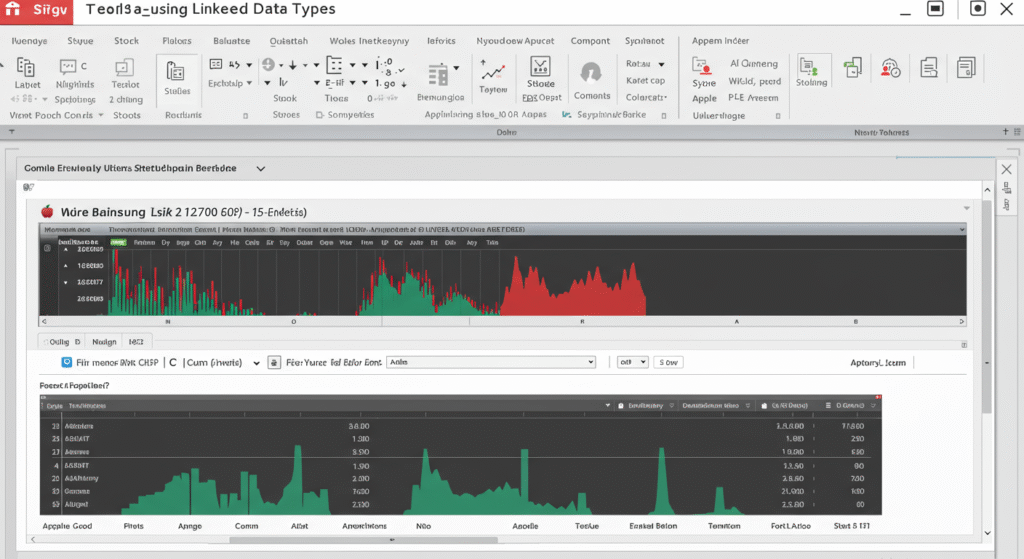
Use: Track a portfolio with live prices, volume, and market cap.
Example: Type “AAPL”, convert to Stock type, and extract Price, 52-week high, Dividend.
Bonus: Combine with conditional formatting to highlight top movers.
🌍 2. Country Comparisons for Market Research
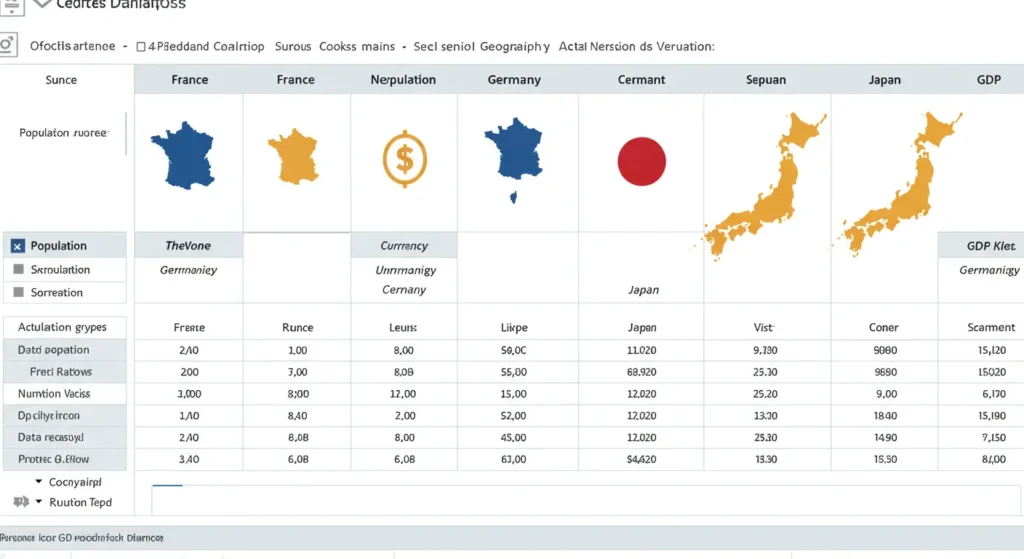
Use: Compare multiple countries across population, GDP, or currency.
Example: List “France, Germany, Japan”, convert to Geography, extract fields.
Pro Tip: Use =A2.Currency in formulas and charts to create dynamic visualizations.
🍎 3. Educational Content for Teachers and Students
Use: Teach students about planets, elements, food, or chemistry data.
Example: Type “Iron, Hydrogen, Oxygen,” convert to Element data type via Wolfram.
Data Available: Atomic weight, melting point, boiling point, symbol.
🏢 4. Pulling Organizational Data via Power BI
Use: Bring in CRM or sales data as structured linked records.
Example: “Sales Region: West” pulls in associated KPIs, revenue, team size.
Best For: Managers, analysts, and executive dashboards.
✈️ 5. Trip or Event Planning with Location Data
Use: Plan a multi-city trip with timezone, country, or weather fields.
Example: List cities, convert to Geography, extract Timezone, Local Leader, Population.
Fun Add-On: Add Image or Flag field to spice up presentations or reports.
🧮 Using Linked Data in Formulas
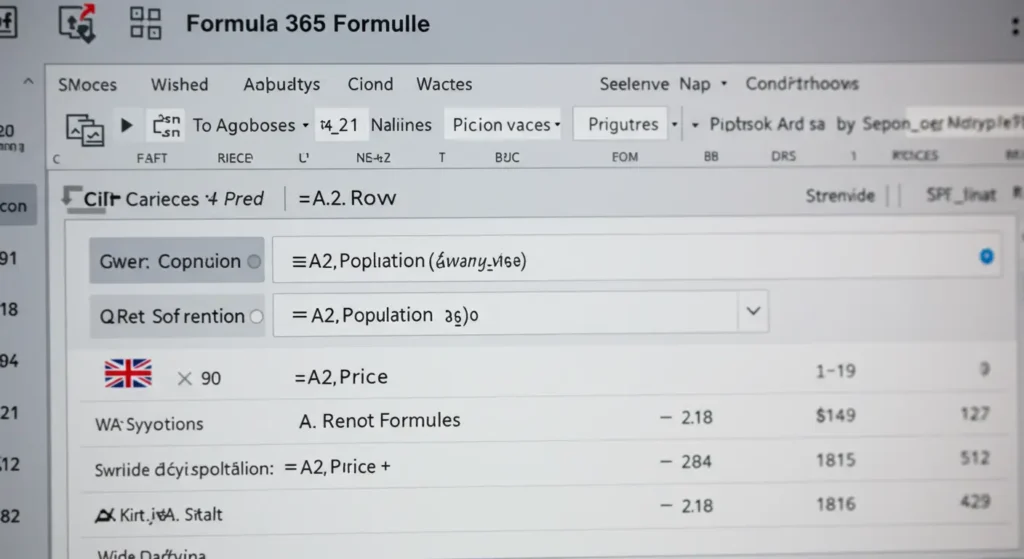
Once a cell is linked, you can reference its fields just like objects:
excelCopyEdit=A2.Price
=A2.Population
=A2.["GDP per capita"]
Yes, even spaces and special characters in field names are handled easily when wrapped in brackets.
You can combine them with formulas too:
excelCopyEdit=IF(A2.Population > 100000000, "Large", "Small")
=ROUND(A2.Price * B2, 2)
⚡ Tips for Working Faster with Linked Data Types
🔧 1. Use Table Format
Convert your range to a Table (Ctrl+T) to auto-fill fields across rows dynamically.
🏷️ 2. Rename Your Columns
Excel uses the field name by default—but you can rename for clarity or charting purposes.
🔁 3. Refresh Data
Go to Data → Refresh All to update linked values.
📌 4. Copy Data Without the Link
Use Paste Values if you want to keep the data static (e.g., for reports or exports).
📎 5. Add Images
Fields like “Flag” or “Company Logo” can be added directly as cell images—great for branding or client sheets.
⚠️ Common Pitfalls (And How to Avoid Them)
- Not Recognized? Excel may not identify your entity. Try correcting spelling or adding more context (e.g., “Paris, France”).
- Field Missing? Not every data type includes the same fields. Use the data card to explore available options.
- Wrong Conversion? Undo and retry with a more specific term or category.
- Data Not Refreshing? You might be offline or Excel needs a manual update.
🔐 Linked Data and Privacy
Wondering if your company data is exposed when using these smart features?
✅ Microsoft ensures that personal and organizational data types (like Power BI ones) are secure and accessible only within your tenant.
✅ For public types (like Stocks or Geography), Excel uses trusted third-party APIs like Bing or Wolfram with secure channels.
🧪 Experimental: Create Your Own Data Types with Power Query
Yes, you can create custom linked data types using Power Query in Excel 365.
How?
- Load a table from Excel, web, or database using Power Query.
- Transform it into a structured record per row.
- Load it back into Excel as a custom data type.
You can then use these just like Microsoft’s built-in data types. It’s powerful for advanced users and businesses with specific needs (e.g., SKUs, project trackers, etc.).
🌐 What’s New in Linked Data Types for Excel 2025 (Preview)
If you’re using an insider build or preview of Excel 2025, here are some exciting enhancements:
- Multi-field extraction with Auto Fill
- AI Copilot support for data types (“Show me top 5 countries by GDP”)
- Cross-app linking with PowerPoint and Word for live updates
- Smart card previews with richer media and interactivity
- Voice prompts for inserting data from linked types (experimental)
📚 Best Practices for Mastering Linked Data Types
- Use them for dashboards, research, reports, and data entry automation.
- Explore lesser-known data types like Food, Exercise, Universities, or Diseases from the Wolfram library.
- Combine them with other Excel features like:
XLOOKUPLET()andLAMBDA()- Dynamic Arrays
- Conditional Formatting
- Power Query
🎯 Summary: Linked Data Types = A Smarter Way to Excel
Linked Data Types in Excel 365 are not just shiny extras—they’re deeply practical tools that can help you:
- Enrich your data without manual research
- Reduce formula complexity
- Make interactive dashboards
- Work across internal and public data sources
- Stay up to date, automatically
Whether you’re a student, analyst, teacher, or small business owner, this feature is your shortcut to cleaner, faster, and smarter spreadsheets.
💬 What Do You Think?
Have you started using Linked Data Types in your day-to-day Excel work? Are you planning to explore them now that you know how versatile they are?
👇 Drop a comment below to share your experience—or ask a question!
And if you found this article helpful, feel free to share it with your spreadsheet-loving friends and coworkers!