

1. Are You Outgrowing Excel?
Let’s face it—Excel is like that high school best friend who helped you through every math test, budget plan, and last-minute report. It’s reliable, flexible, and has been around forever. But even the best relationships hit rough patches, especially when your files start crashing and your VLOOKUPs look more like VLOOK-oops.
Have you ever opened an Excel workbook and waited longer for it to load than your coffee to brew? Or maybe you’ve got a file named something like Q3_Sales_FINAL_FINAL_v3.xlsx because nobody ever uses version control. Welcome to the tipping point.
Here’s the truth: if your Monday mornings are dominated by manually refreshing pivot tables, updating 10 tabs of charts, and praying Excel doesn’t freeze when you paste in new data—you’re ready to level up. And no, it doesn’t mean ditching Excel altogether. It means knowing when to use Power BI over Excel.
Enter: Power BI—Microsoft’s modern, scalable, dashboard-delivering, data-visualizing, refresh-automating supertool. If Excel is the Swiss Army knife, Power BI is the precision-engineered data sword. It’s built for business reporting at scale, and it’s designed to help you tell stories with your data—not just wrangle it.
So, if you’ve been wondering about the Excel vs Power BI debate, or felt that Excel is great but… not quite enough anymore—you’re in the right place. This guide will walk you through when, why, and how to make the move. And no, you don’t need to be a data scientist. You just need to be ready.
2. Excel’s Strengths: What It Still Does Well

Excel Strengths
Before we get too caught up in the Power BI hype train, let’s give Excel its well-earned standing ovation. Excel’s not going anywhere—it still shines like a freshly formatted cell in plenty of scenarios.
Here’s what Excel still absolutely nails:
-
Quick, small-scale analysis: Need to sort some numbers, run a few formulas, and slap on a pie chart? Excel’s your go-to.
-
Familiar interface: Rows, columns, formulas—we’ve been using Excel so long we can SUM and VLOOKUP in our sleep.
-
PivotTables and Slicers: Want to build an interactive dashboard with some filters? You can actually do that pretty well right inside Excel.
-
Light reporting: For monthly updates, small datasets, or one-off visuals, Excel keeps it fast and friction-free.
✅ Example Time: Let’s say you’re a sales analyst putting together a Q1 dashboard. You pull some CSV exports from your CRM, drop them into a sheet, create PivotTables for regions and reps, and use Slicers to filter by month. Boom. You’ve got a working dashboard in under an hour. That’s Excel magic.
Excel also wins in personal productivity. You don’t need a server, IT approval, or a user license. You just… open Excel and go. For individual contributors, it’s often the fastest tool for ad hoc analysis.
But, as your reporting becomes more complex—multiple data sources, dynamic dashboards, interactive sharing—Excel starts to feel like fitting a square peg into a very round, very large, Power BI-shaped hole.
So let’s talk about when it stops being a hero and starts being a headache.
3. The Signs: When Excel Is Holding You Back

The Signs
Ah, the dreaded Excel pain points. You know them well—probably too well. If you’re nodding along to any of these, it’s time to seriously consider Power BI.
🧨 The Top 5 Signs You’ve Outgrown Excel
-
Your file is over 100MB—and growing daily
Excel chokes. You pray it doesn’t crash. You’re afraid to add another sheet because it might combust. -
Everyone’s working on different versions of the truth
IsQ3_Report_v8_FINAL.xlsxthe latest file? Or is itQ3_Report_v9_FINALFINAL_UPDATED.xlsx? Who even knows anymore? -
Data refreshes are manual and error-prone
You’re copy-pasting from systems, double-checking values, updating charts by hand—and still finding mistakes after sending the report. -
You need data from multiple places
One tab from Salesforce, another from your SQL server, another from an Excel export on OneDrive… and none of it refreshes automatically. -
You can’t share insights easily
Want to show your exec team an update? You either email the file (and hope they don’t break the formulas) or take screenshots.
These aren’t just annoying—they’re signs you’re spending time wrestling with tools instead of analyzing data. You’re duct-taping dashboards together with hope and Ctrl+Z.
At this point, your reporting needs more than formulas. You need data modeling, real-time dashboards, and one-click sharing. You need Power BI.
4. What Is Power BI? A Simple Primer
What Is Power BI
Think of Power BI as Excel’s overachieving younger sibling who went to data college and came back with superpowers. It’s part of the Microsoft Power Platform and is purpose-built for turning raw data into rich, interactive dashboards that look good on any screen.
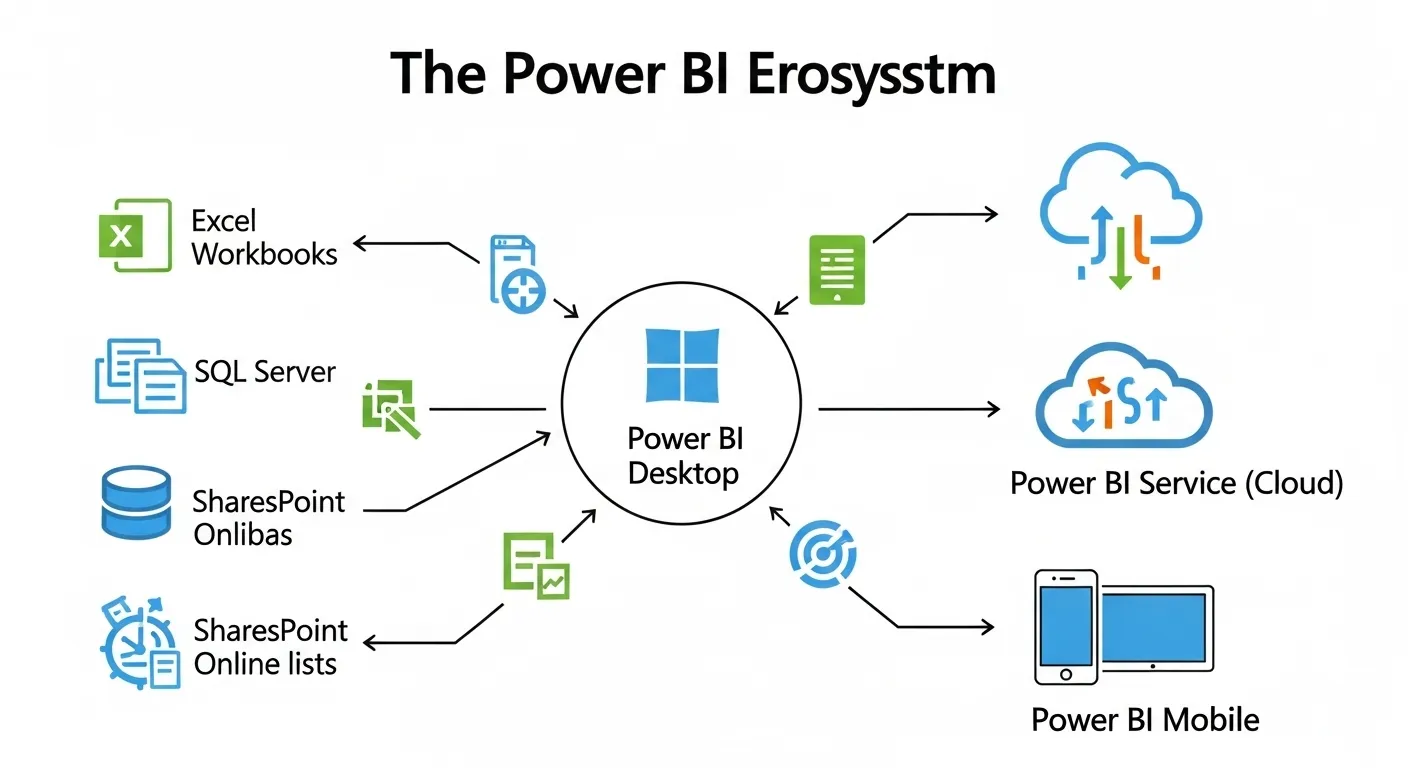
🧠 The Core Components:
-
Power BI Desktop – The app where you build your reports (it’s free!).
-
Power BI Service (Web) – Where you publish and share dashboards online.
-
Power BI Mobile – For tracking KPIs and insights on the go.
Unlike Excel, Power BI is centered around data modeling. It can connect to multiple sources (Excel, SQL, SharePoint, APIs—you name it), clean the data, define relationships, and visualize it in compelling ways using DAX (think Excel formulas 2.0).
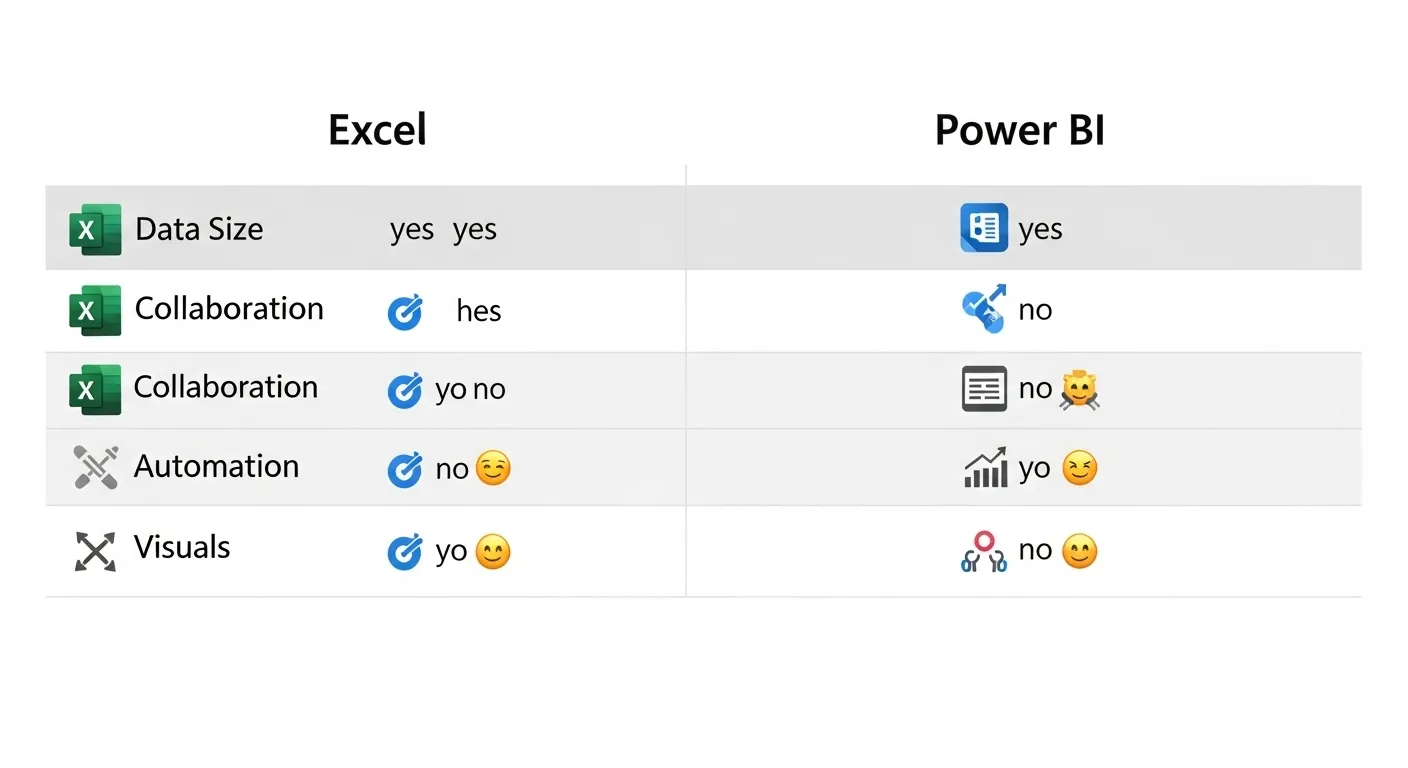
✅ Quick Comparison: Excel vs Power BI
| Feature | Excel | Power BI |
|---|---|---|
| Data volume handling | Limited | Large-scale, optimized |
| Interactivity | Basic (Slicers, filters) | Advanced dashboards |
| Automation | Manual | Scheduled refreshes |
| Sharing & Collaboration | Email-based | Cloud-based, real-time |
| Visual Storytelling | Charts | Stunning visuals + filters |
Bottom line? Power BI isn’t here to replace Excel—it’s here to do what Excel can’t.
5. The Power BI Benefits Excel Users Love
The Power BI Benefits Excel Users Love
So what exactly makes Power BI feel like a cheat code for Excel users? Let’s talk benefits—real ones you’ll notice from day one.
💡 1. No More Manual Refreshes
Power BI lets you connect directly to your data sources—Excel files, SharePoint folders, SQL databases, cloud services, and more. Set up scheduled refreshes, and your dashboards update automagically. No more “Oops, I forgot to paste in last month’s data.”
💡 2. One Dashboard to Rule Them All
Build one report. Publish it to Power BI Service. Share a link with your manager, team, or CEO. They get real-time insights without breaking your formulas. No versioning nightmares, no accidental overwrites—just clean, current data.
💡 3. Drag-and-Drop Visuals That Wow
Power BI gives you bar charts, line charts, gauges, KPI cards, maps, slicers, and so much more—with far more polish and interactivity than Excel. Want to click on a chart and filter the whole dashboard? Done. Want to build a report your boss can click through on their iPad? Easy.
💡 4. Scalable for Big Data
We’re talking millions of rows, not just a few thousand. Power BI’s columnar data engine (VertiPaq) is optimized for performance. Your reports load fast, and large datasets don’t slow it down.
💡 5. Cleaner, Safer Collaboration
Because Power BI is cloud-first, you can:
-
Control who sees what with row-level security
-
Create different views for different teams
-
Eliminate endless email attachments
✅ Bonus: You can even embed Power BI dashboards in Microsoft Teams or SharePoint pages—seamless integration across your workspaces.
Once Excel users get a taste of Power BI’s automation, storytelling power, and performance… they don’t go back. It’s like switching from a flip phone to a smartphone—you’ll wonder how you ever survived without it.
6. How to Transition Smoothly from Excel to Power BI
How to Transition Smoothly from Excel to Power BI
Good news: if you’re already great at Excel, you’re not starting from scratch. Power BI feels familiar—but more powerful.
Here’s a roadmap to ease your transition:
🧭 Step 1: Start in Excel, Then Import
You can bring in your existing Excel data, tables, and even PivotTables into Power BI. It recognizes tables, named ranges, and sheet structures.
💡 Pro tip: Make your Excel files “Power BI-friendly” by converting data into Excel Tables before import.
🧭 Step 2: Learn Power Query (It’s Like Excel on Steroids)
Power BI uses Power Query for data transformation—the same tool you may have seen in Excel under “Get & Transform.” Learn it once, use it in both tools. Think of it as a cleaner, more powerful replacement for nested IF statements and complex formulas.
🧭 Step 3: Learn DAX (Data Analysis Expressions)
DAX is Power BI’s formula language. It’s like Excel formulas but designed for analyzing data models. You’ll find familiar functions like SUM(), IF(), and AVERAGE(), but you’ll also unlock time intelligence like:
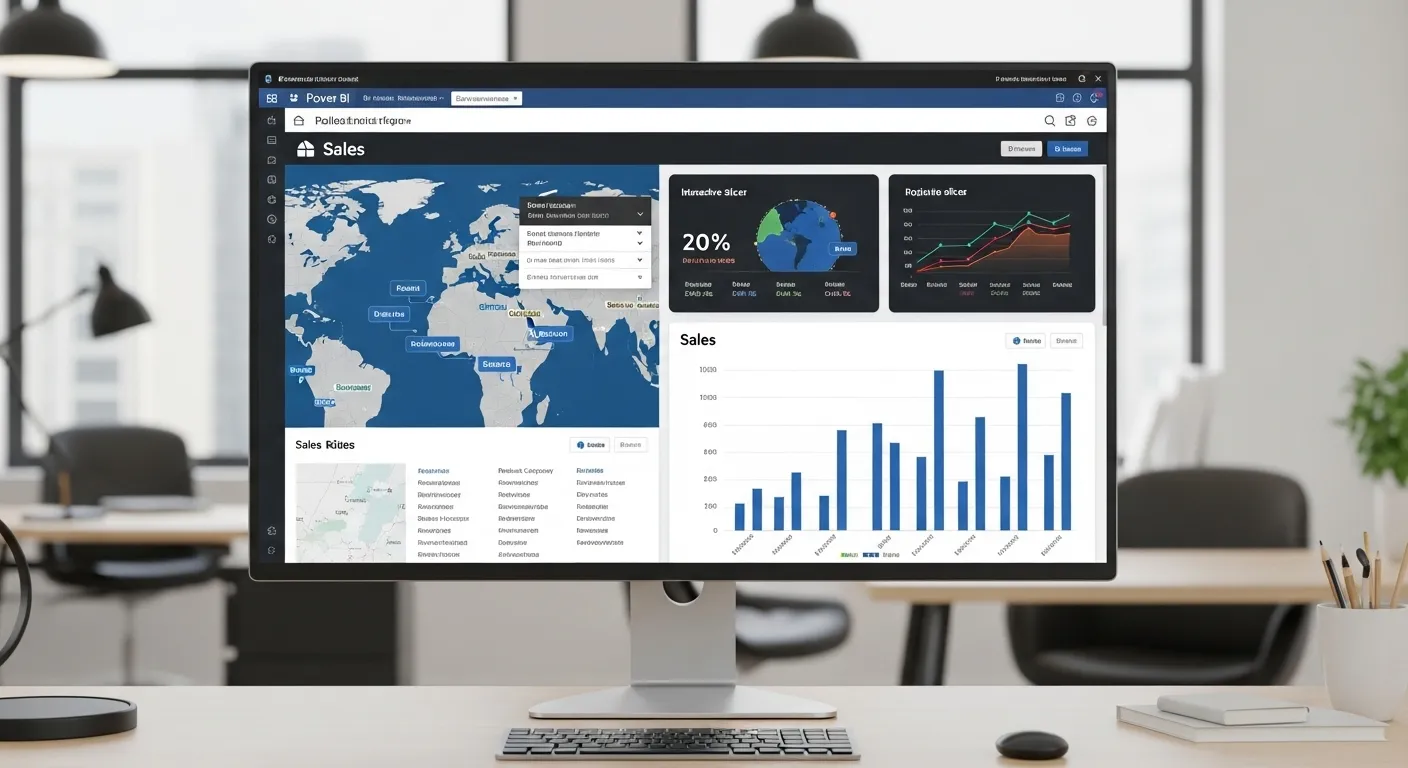
🧭 Step 4: Build Your First Dashboard
Start with something simple—maybe a sales report or marketing funnel. Add some slicers, filters, and KPIs. Watch it come alive.
🧭 Step 5: Share and Collaborate
Once you publish to the Power BI Service, invite stakeholders to interact with your dashboard in real time. Watch their eyes light up.
🎓 Training Tip: Microsoft Learn, LinkedIn Learning, and YouTube are packed with beginner-friendly tutorials.
Power BI won’t replace Excel, but it will enhance your reporting workflows and free up hours of manual work. Transition at your pace—but don’t be afraid to make the leap.
7. When to Use Power BI vs Excel – The Real-World Scenarios
Let’s make this practical. When should you stick with Excel, and when is Power BI the clear winner?
| Scenario | Use Excel If… | Use Power BI If… |
|---|---|---|
| Small, quick reports | You need to do light analysis or personal calculations. | Your report needs dynamic visuals and cloud sharing. |
| Data sources | You’re working from a single source or CSV. | You’re pulling from multiple databases, APIs, or cloud tools. |
| Automation | You’re okay with manual updates and formulas. | You want scheduled refreshes, automated pipelines. |
| Sharing | You’re emailing files or printing PDFs. | You want a single live dashboard everyone can access. |
| Visuals | Basic charts are fine. | You want rich, interactive dashboards that scale. |
| Collaboration | One person controls the file. | Multiple people need different views and security levels. |
✅ Real Example: Your CEO wants a sales dashboard updated every Monday.
With Excel: You open a file, paste in new data, refresh charts, save as PDF, and email it.
With Power BI: You schedule a refresh, and your CEO opens the same link every Monday. Done.
8. Final Thoughts: The Power Pivot (Pun Intended)
Look, Excel will always have a place in our hearts—and in our toolkits. But if your dashboards are ballooning, your data is multiplying, and your brain is melting from update fatigue… it’s time to evolve.
Think of Power BI for business reporting as your next-level upgrade. It’s not about replacing Excel—it’s about amplifying what you already know to work faster, smarter, and with fewer Ctrl+Z moments.
The best part? You don’t have to go all-in overnight. You can start small—connect a spreadsheet, build a visual, play with a slicer. One dashboard later, and you’ll wonder how you ever lived without it.
💥 So if Excel feels like it’s groaning under the weight of your ambitions… Power BI is here to help carry the load.
Go ahead, make the pivot.
9. FAQs from Excel Users (A.K.A. “Excelers Anonymous”)
Welcome to the confessional, friend. We know you’ve been cozy with Excel for years. You’ve cried into your VLOOKUPs, proudly nested IF statements like a Russian matryoshka doll, and defended your massive, crash-prone files like a proud digital parent. But now you’re hearing whispers about this mysterious Power BI and thinking… is it time?
Let’s get your most common questions answered—with joy, sass, and no jargon-heavy guilt trips.
Q1: Is Power BI free? Or is this another budget ambush like printer ink?
Ah yes, the golden question. Is Power BI free?
Answer: Mostly, yes!
Power BI Desktop—the tool you use to create those jaw-dropping dashboards—is totally, utterly, gloriously free.
You can download it from the Microsoft Store or the Power BI website, no credit card or shady auto-renew required. You can load up your Excel files, transform data, and build snazzy visuals without spending a dime.
BUT (and there’s always a “but,” right?), if you want to share your dashboards with teammates, publish to the cloud, or set up automated data refreshes, you’ll need a Power BI Pro license. As of 2025, that’s $10 per user per month—about the price of two oat milk lattes or one trip to the vending machine if you’re feeling fancy.
Still cheaper than therapy for Excel-induced spreadsheet trauma.
Q2: Do I have to give up Excel to use Power BI? Like, are they fighting or something?
Oh no, no, no. Excel and Power BI aren’t fighting.
They’re coworkers. In fact, they’re practically work spouses.
Excel is like the charming old-timer who’s seen some things and knows a million tricks. Power BI is the hotshot new hire with fancy graphs and a cloud-based workspace. Together, they’re unstoppable.
You can use Excel for prepping your data, crunching numbers, or modeling something super specific. Then—bam—import that Excel file right into Power BI and visualize it like a rockstar.
You can even embed Excel files directly inside Power BI dashboards, or pin Excel reports into your workspace.
TL;DR: You’re not breaking up with Excel. You’re just…opening the relationship.
Q3: Is Power BI hard to learn? Be honest—I still Google how to do conditional formatting.
Let me put it this way: If you’ve survived INDEX/MATCH, you can absolutely learn Power BI.
Here’s the breakdown:
-
The interface is intuitive—drag, drop, click, done.
-
Power Query feels like Excel’s Power Automate cousin. It’s all about cleaning and shaping data without formulas.
-
DAX (Data Analysis Expressions) is like Excel formulas with a protein shake. A bit beefier, but surprisingly familiar.
-
There are tons of free learning paths from Microsoft and YouTube wizards who speak fluent Excel-to-Power BI.
Yes, there’s a learning curve, but it’s more like a fun hike than climbing Mount Everest. And you can take snack breaks.
💡 Excel User Tip: If you know PivotTables, you’re already halfway there. Power BI loves tables, slicers, and categories just like Excel—only it shows them off in cooler outfits.
Q4: Can I use my Excel files in Power BI? Or do I need to reinvent the data wheel?
Absolutely! Power BI speaks fluent Excel.
You can:
✅ Connect to local Excel files
✅ Connect to files stored in OneDrive or SharePoint
✅ Refresh data automatically
✅ Even use named ranges or tables inside your Excel workbook
Heck, you can even combine multiple Excel files into one dataset using Power Query. It’s like Excel on performance-enhancing supplements—but legal and without the guilt.
💡 Pro Tip: Save your Excel files to OneDrive or SharePoint and connect them to Power BI with auto-refresh turned on. It’s like having a robot update your reports every day. No more frantic Monday morning updates while your coffee goes cold.
Q5: What’s the difference between Power Pivot, Power Query, and Power BI? Are they siblings? Cousins? Evil twins?
Great question! It’s confusing because the names all start with “Power” (Microsoft got a little too enthusiastic with branding here). But here’s your no-fluff, human explanation:
🥇 Power Query – The cleaner
-
Think of Power Query as the Marie Kondo of data. It removes mess, organizes stuff, and gets your data looking presentable.
-
You use it to import, transform, combine, and filter data.
-
It’s in both Excel and Power BI.
🥈 Power Pivot – The brain
-
Power Pivot is where you model your data—build relationships, create calculated columns, and write DAX.
-
It lives inside Excel, but Power BI’s data model works the same way (just more powerful).
-
It’s like building a database, but without needing an IT degree.
🥇 Power BI – The whole party
-
Power BI wraps Power Query and Power Pivot in a beautiful visual layer.
-
It’s where you create dashboards, reports, and interactive visuals.
-
Also includes sharing, security, mobile access, and more.
📦 TL;DR:
Power Query cleans.
Power Pivot thinks.
Power BI dazzles.
Q6: Is Power BI just for big companies with data teams and nap pods?
Nope. Power BI is for the people!
It’s used by solo freelancers, small businesses, departments, and yes, corporate behemoths. The beauty of Power BI is that you can scale it up or down to your needs.
-
If you’re just reporting on Excel data for one project? You’re good.
-
If your team needs to see live KPIs every morning? Still good.
-
If your CFO wants mobile access to dashboards on a beach in Bali? Power BI’s got it covered.
You don’t need an IT department or a data science degree. You just need curiosity and maybe a YouTube playlist.
Q7: Do I need to learn DAX immediately? Like… today?
Nope. You can absolutely get started in Power BI without touching DAX (just like you didn’t touch VBA in Excel until forced by circumstance).
DAX is useful—and powerful. But you can:
-
Load and clean data with Power Query
-
Create visualizations
-
Use prebuilt summaries (like SUM, COUNT, AVERAGE)
-
Filter with slicers and visuals
Once you’re ready, DAX opens doors to custom metrics, fancy calculations, and leaderboard-worthy analytics. But it’s a “learn as you go” situation. Like seasoning in cooking—start light and add more when you feel bold.
💡 Excel user comfort food: DAX functions include favorites like IF, SUM, SWITCH, CALCULATE, and more. You’ll feel at home.
Q8: Can Power BI really replace all my Excel reports? Even the ones I’ve named after Star Wars planets?
Let’s be honest: some of those Excel files have been with you longer than your Netflix password. Giving them up is emotional.
And the truth is—you don’t have to give them up.
Power BI can absolutely handle:
-
Monthly KPIs
-
Sales dashboards
-
Financial summaries
-
Performance reports
-
Survey data analysis
But it’s not built for things like budgeting templates, invoice generators, or cell-level what-if calculators. Excel is still king for those granular spreadsheet tasks.
So don’t worry. Your file named “TATOOINE_Q2_2024_FINAL_FINAL(2).xlsx” can live on… maybe just in a more supporting role.
Q9: What’s the deal with Power Bi dashboards vs reports? Are they the same?
Not quite! This one’s a bit nerdy, but stick with me:
📝 Power BI Report
-
A multi-page, interactive file built in Power BI Desktop.
-
Think of it like a full PowerPoint presentation made of visuals and data.
-
Each page can have multiple charts, slicers, and tables.
📊 Power BI Dashboard
-
A single-page snapshot created in the Power BI Service.
-
Think of it like your mission control screen—KPI highlights, live tiles, and alerts.
-
Dashboards can pull visuals from multiple reports and datasets.
💡 Analogy: Reports are the book. Dashboards are the cover with all the juicy highlights.
Q10: Will using Power BI make me look like a data rockstar?
Absolutely. But not just look—you’ll become one.
You’ll go from emailing 12 versions of a spreadsheet to publishing live dashboards that update automatically. You’ll stop copying and pasting CSVs and start automating data flows. You’ll wow your team with interactive charts that respond to clicks and filters.
And best of all?
You’ll free up time—precious time—to do more impactful work. Or take an actual lunch break that isn’t just coffee and regret.
🙌 Final Pep Talk
If you’re reading this, you’re already data-curious. And that’s the first step.
Power BI isn’t here to replace your Excel chops—it’s here to amplify them. To let you do more with less. To stop the madness of manual updates, and finally give your charts the home they deserve.
Whether you start small or dive right in, just know:
You’ve got this. Excel taught you more than you think. It is the next step in your evolution. 🧠⚡